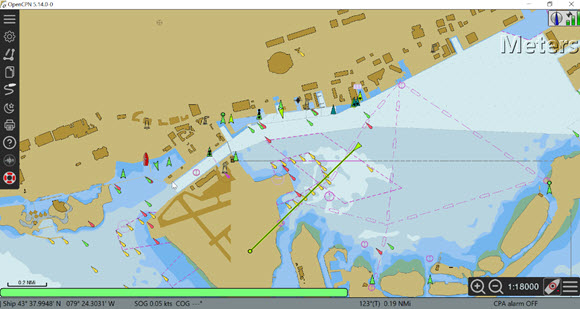
Introduction
In the previous post I looked at receiving AIS on OpenCPN using the latest ECN charts for the Montreal harbour (Ref.1). Since 2017 I have been using Raster BSB charts. In this post I compare various chart formats such as Paper, Raster BSB and ENC. ENC charts are vector charts and contain a wealth of information. By right clicking on any feature you can “Object Query” information about the object.
Equipment Block Diagram
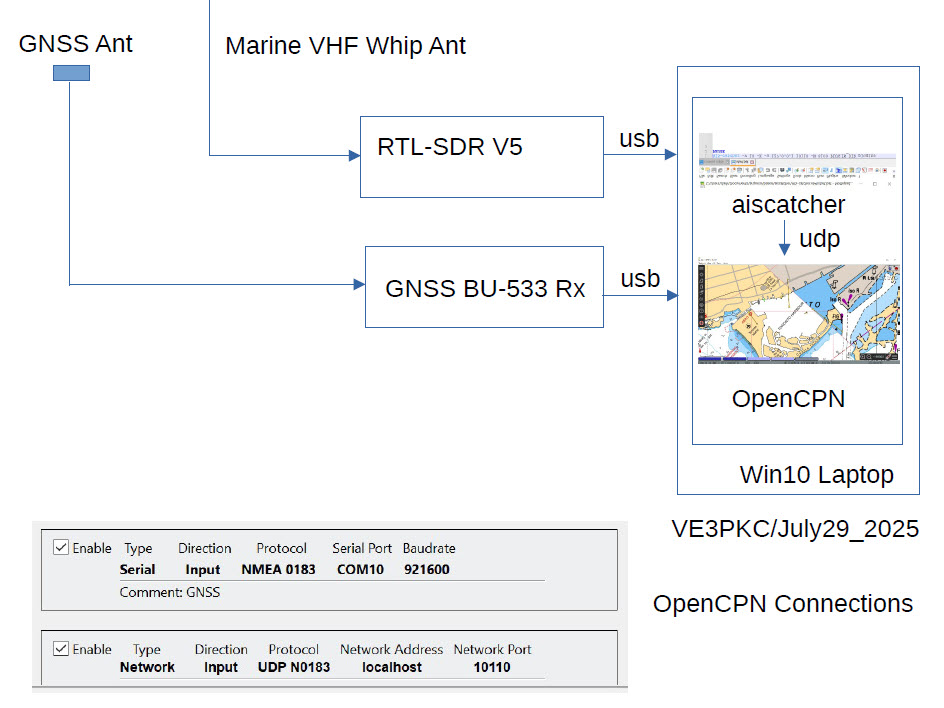
Figure 1 shows the equipment block diagram. This is the same setup I used in Ref.2 . The antenna in this case was a simple 16inch retractable whip.
ENC Charts vs. Paper, RNC_BSB, GEarth
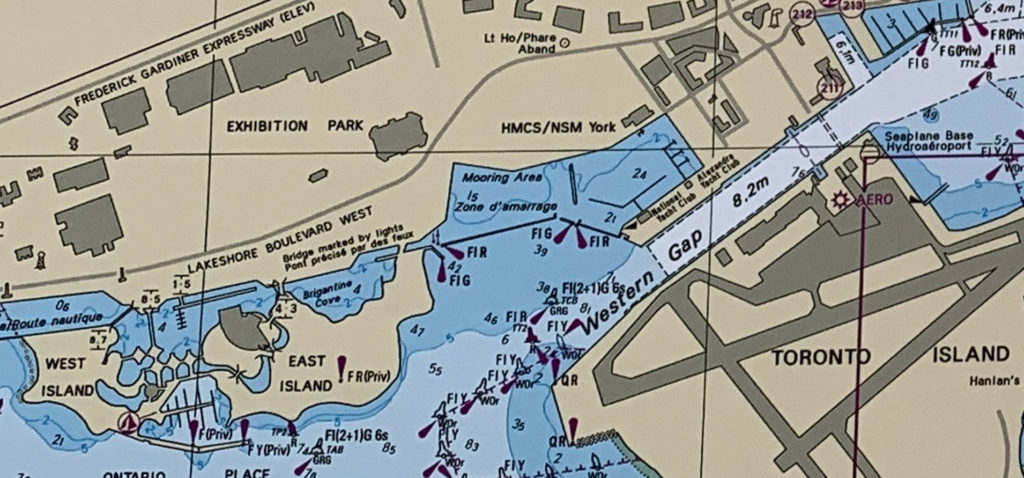
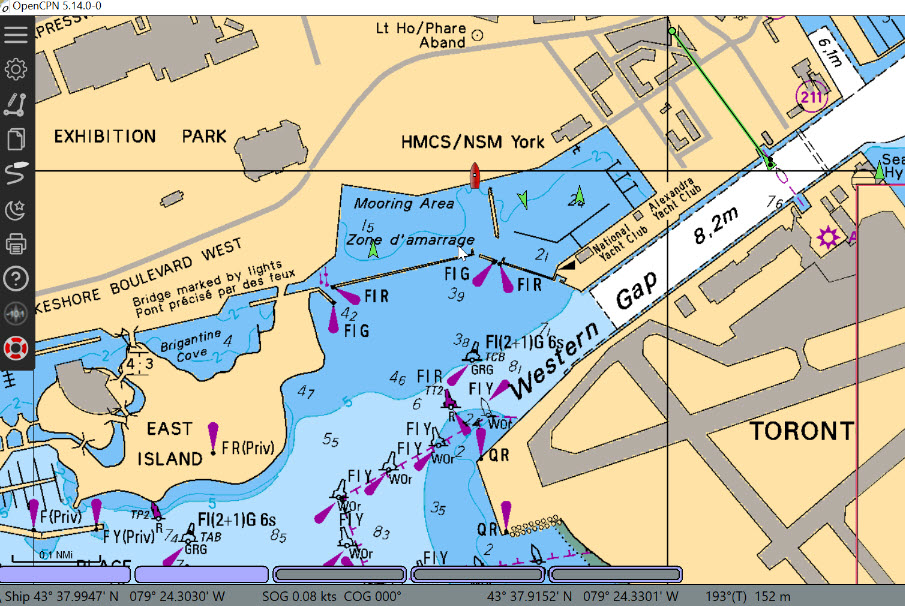
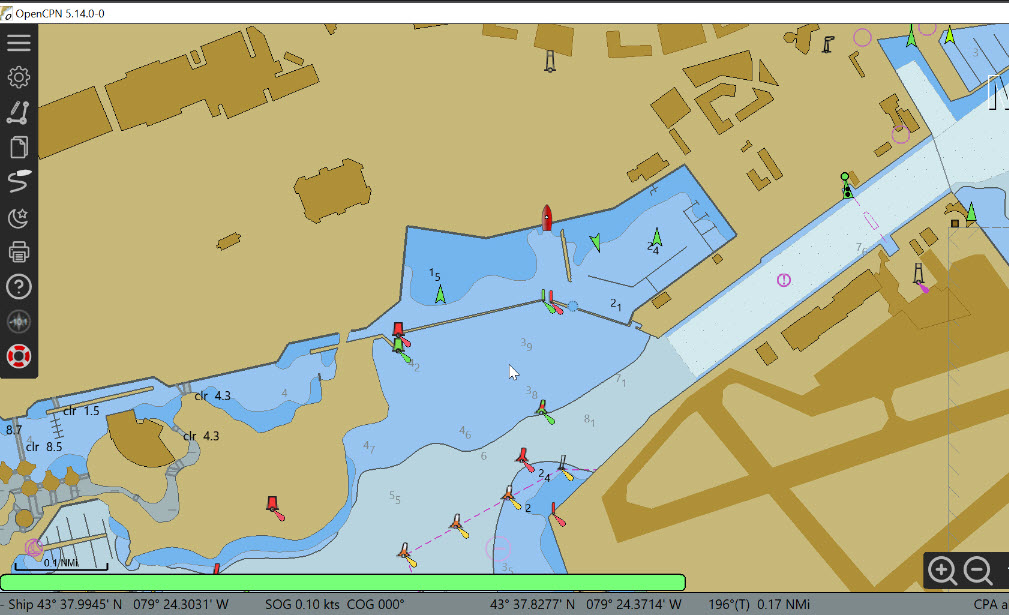
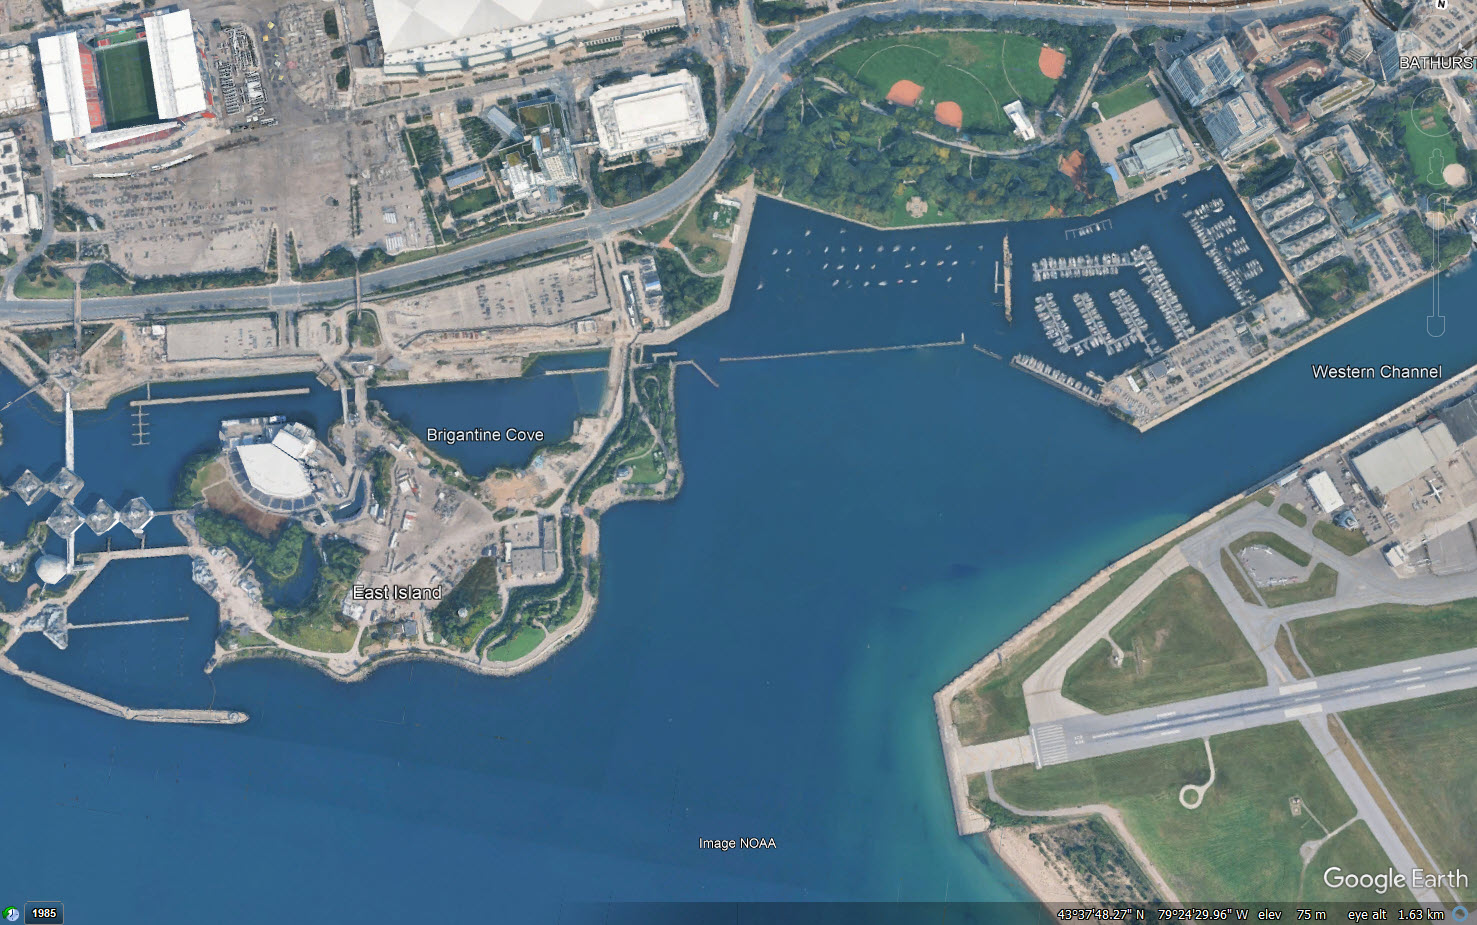
Figure 2 shows the Toronto Harbour as taken from Canadian Nautical Paper chart 2085. Figure 3 shows the Toronto Harbour on Canadian Nautical Raster BSB chart. Notice the raster chart is basically a photograph of the paper chart with no additional data. Figure 4 shows the Toronto Harbour on Canadian Nautical ECN chart. The ECN chart is a vector chart with layers of embedded information. As the chart is zoomed, more information appears and objects can be clicked (Object Query) to bring up descriptions. Ref.3 is a detailed guide to ECN charts. Ref.4 is the Canadian Chart No.1 for Symbols and Abbreviations used in ECNs.
Please send your comments, questions and suggestions to:
contact:

References
#1. – “AIS on OpenCPN ENC Charts”
https://jeremyclark.ca/wp/telecom/ais-on-opencpn-enc-charts/
#2. – “AIS & GNSS on OpenCPN”
https://jeremyclark.ca/wp/telecom/ais-gnss-on-opencpn/
#3. – “Introduction to Electronic Chart Navigation With an Annotated ECDIS Chart No. 1”, 2017, David Burch, ISBN 978-0-914025-57-3
#4. – “Canadian Chart 1 Symbols, Abbreviations & Terms”
https://www.charts.gc.ca/publications/chart1-carte1/index-eng.html
