In a previous post Ref.1 I looked at VOACAP and it’s use in a simple off air receive situation. In this post I will delve a little further into the software and compare the results against some simple mathematical models. VOACAP (Voice of America Coverage Analysis Program) is free professional high-frequency (HF) propagation prediction software from NTIA/ITS, originally developed for Voice of America (VOA). It is available as web based Ref.2 (maintained by Jari Perkiömäki OH6BG/OG6G ) or stand alone Ref.3.
It is useful to determine an estimate of the best case receive signal level that can be realized assuming propagation in a lossless atmosphere (Li =Lg=0). Figure 1 shows the case for the maximum hop distance for reflection off an ionospheric layer (outer ring) E, F1 or F2. The maximum hop length is great circle distance AC and the propagation length is (AP+PC). The antenna take off angle is 0 deg. Table 1 shows the max propagation range, distance and delay for the different virtual heights of ionospheric layers E, F1 and F2.


Figure 2 shows the case when the great circle distance is less than the maximum propagation range. Here the antenna take off angle is >0 deg.

The receive signal level in free space is given by the Friis formula. Essentially the signal energy is being dispersed in a sphere of ever increasing radius. The formula can be simplified for Rx levels in dBm, Freq in MHz and Radius in Km.


The free space loss is not the only loss. The real loss will consist of the Free Space Loss Lfs + losses due to absorption in the atmosphere and ground reflection loss in the case of #hops > 1.
Noise at the Rx input will be the Boltzmann thermal noise plus a noise figure fa that takes into account all other sources of noise such as cosmic, man made etc. Formulas can be written in dBm.


Table 2 from ITU Rec P.372-11 shows noise figure fa for various sources and frequencies.

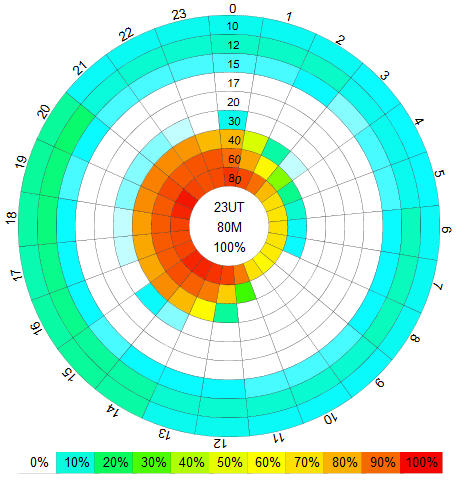
Table 3 shows the summary of results for the path of CHU/VE3PKC on March 26th_2020 at 1300hrs UTC. The great circle distance, bearings, propagation distances and antenna take off angles for E, F1 and F2 were calculated with ScicosLab routines. Antenna gains Gt (Fig.3/5) were determined for these angles using EZNEC Ref. 5. Actual off air signal levels were measured, only 3.33MHz was detected at -90dBm dipping occasionally to -100dBm. VOACAP results were reliability of 80m at 1300hrs UTC = 97% (Fig.7), corresponding to a Rx level of -80dBm (Table 4). This is fairly close to the actual level. Our best case Rx levels with no atmospheric absorption were -30/45 dBm, so this indicates a real absorption of about 45dB.


Download “HF High Frequency Radio Telecommunications Learn by Simulation”

Please send your comments, questions and suggestions to:
contact:

References
#1. VOACAP – CHU to VE3PKC Original Blog Post
https://jeremyclark.ca/wp/telecom/voacap-chu-to-ve3pkc/
#2. VOACAP HF Prediction Software Web Version, Maintained by Jari Perkiömäki
https://www.voacap.com/
#3. VOACP HF Prediction Software Stand Alone, Maintained by Greg Hand
http://www.greg-hand.com/hfwin32.html
#4. HF High Frequency Radio Telecommunications Learn by Simulation
https://www.clarktelecommunications.com/simulation.htm
#5. EZNEC Antenna Software by W7EL
https://www.eznec.com/